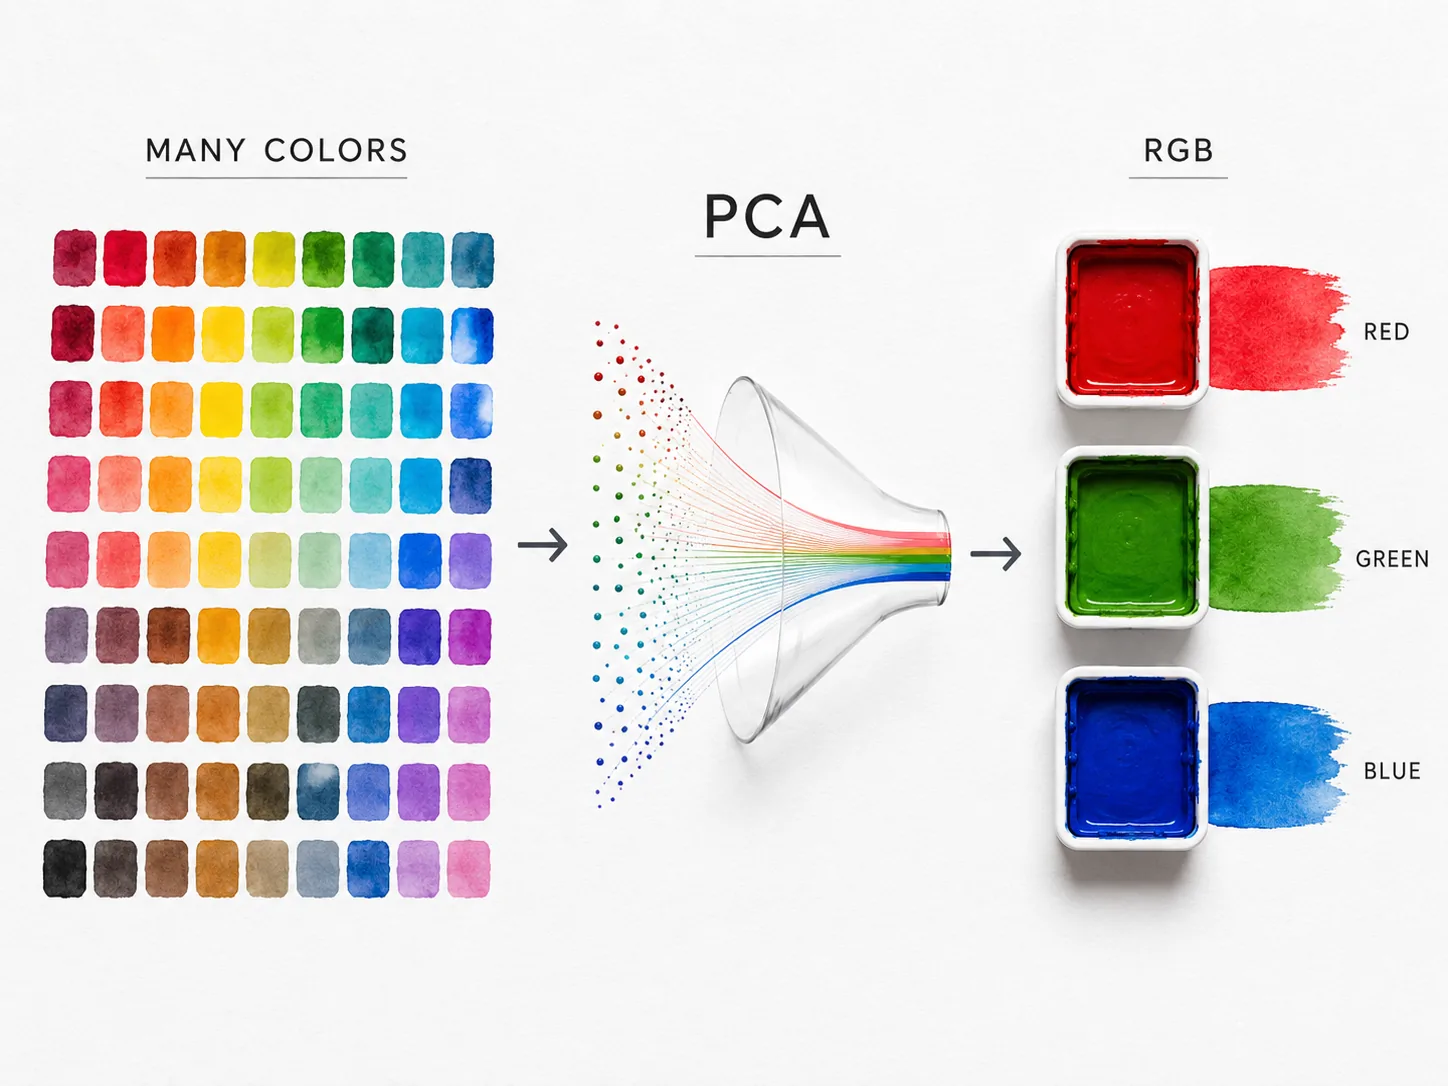
PCA helps reduce data complexity by creating compact principal components that are easier to visualize while preserving most of the important structure in the data.
Move from intuition, to formula, to visual experiment so the concept is easier to retain.
Use the related lab or roadmap after reading to turn the article into practice.
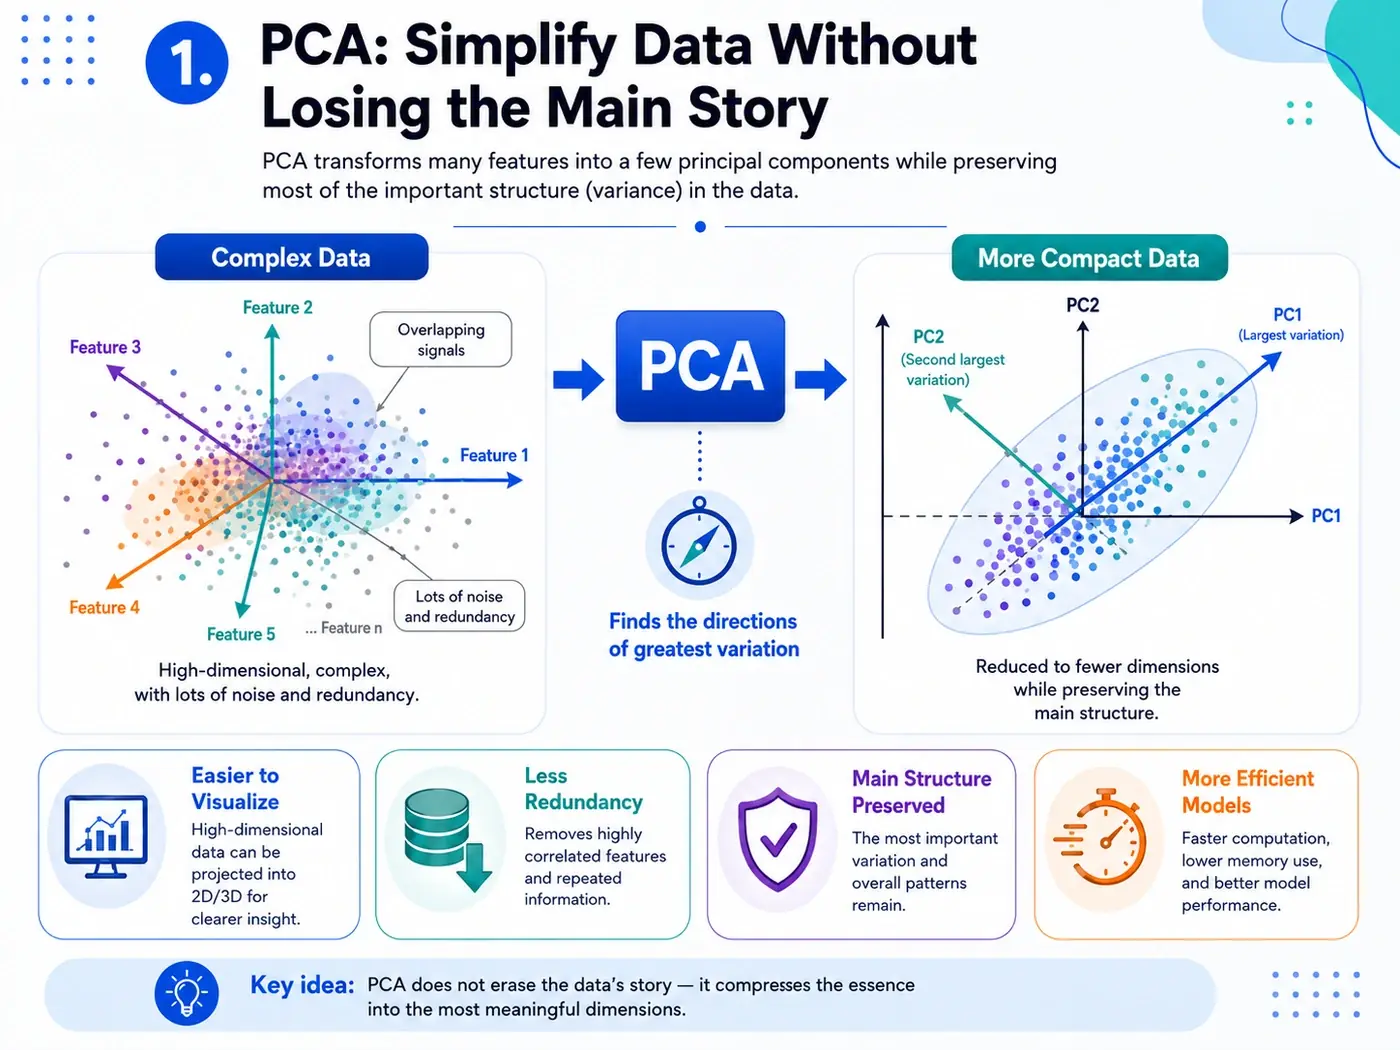
PCA helps us reduce data complexity by creating compact principal components that are easier to visualize while preserving most of the important structure in the data.
What Problem Does PCA Solve?
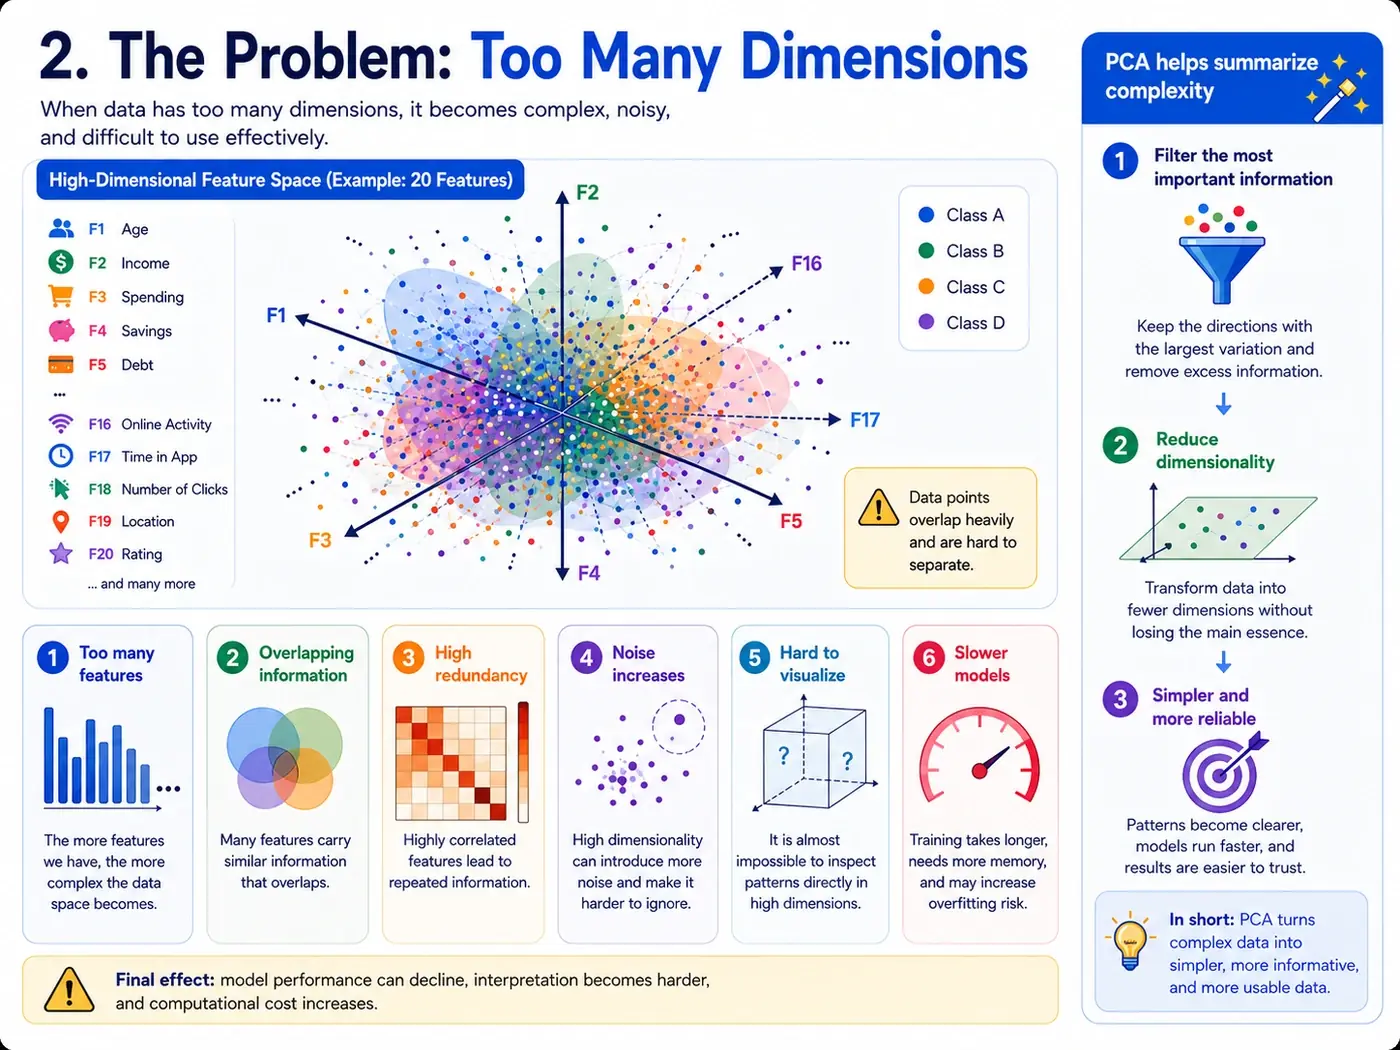
In many machine learning projects, the real difficulty is not always a weak model. The model often struggles because the data is too complex, repetitive, noisy, and full of features that carry overlapping information.
PCA helps us address the problem of too many dimensions. When a dataset contains dozens, hundreds, or thousands of features, the feature space becomes harder to understand, harder to visualize, and often less efficient for modeling.
- Some features overlap heavily.
- Some features repeat signals that already exist elsewhere.
- Some features add more noise than useful information.
- Models can become slower, less stable, and harder to interpret.
The central question behind PCA is simple: can we represent this data in fewer dimensions while preserving most of its important structure?
What Is PCA?
PCA stands for Principal Component Analysis. It analyzes the structure of the data, creates new directions called components, and ranks those components by how much variation they capture.
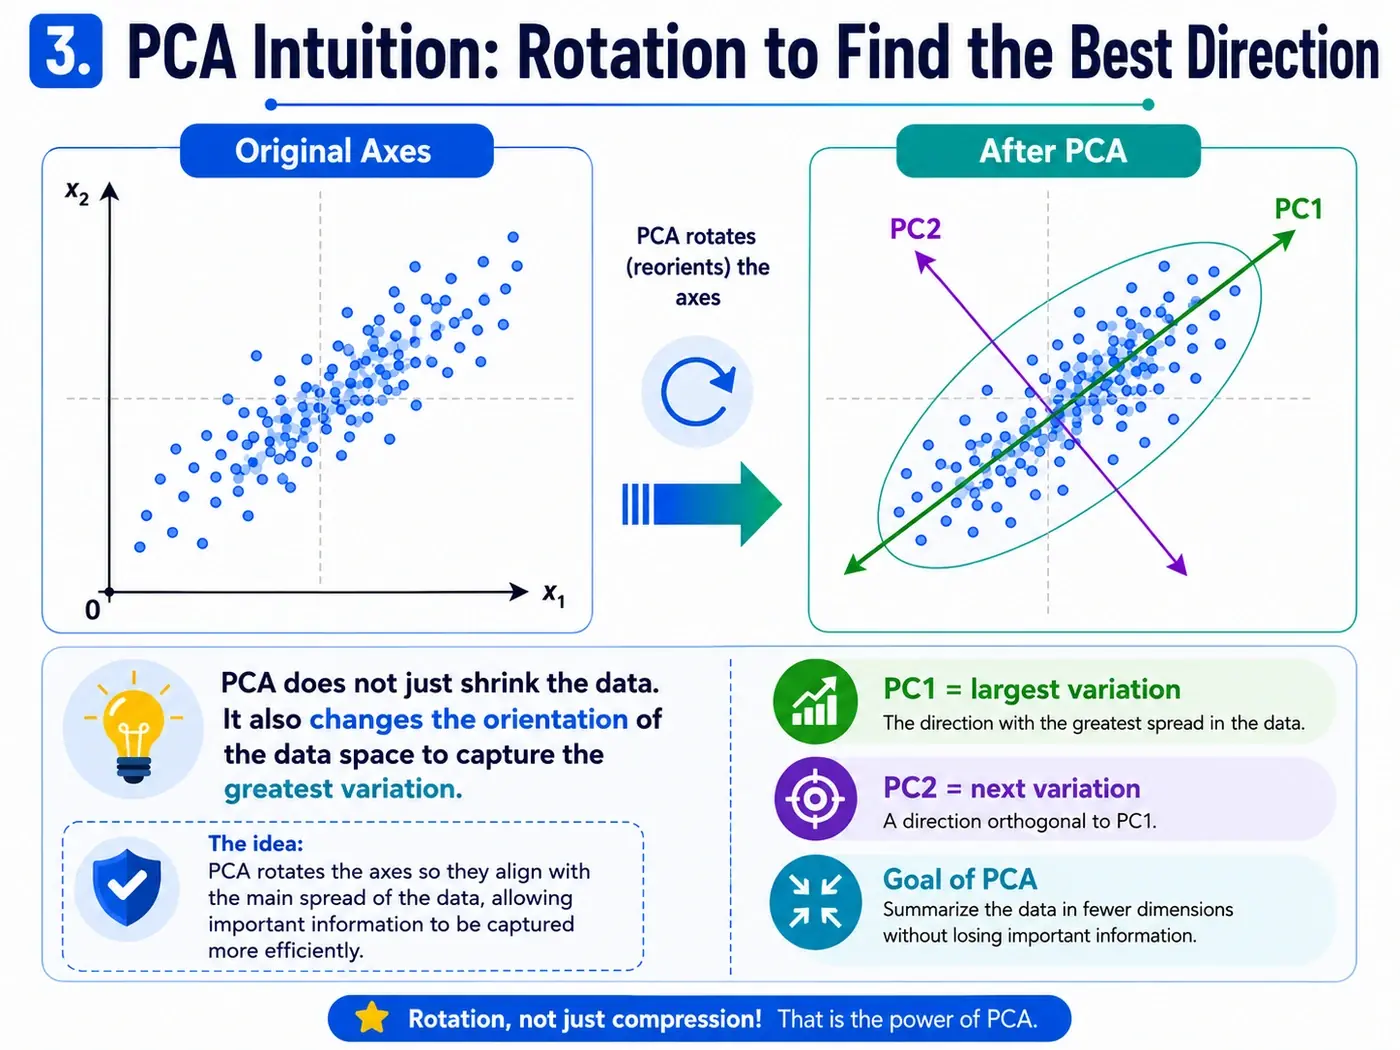
The key concept in PCA is variance. PCA searches for directions where the data spreads the most. The first component captures the largest variation, the second captures the next largest variation, and so on.
PCA Intuition: Rotating the Data Space
Imagine a cloud of points in two-dimensional space. The points do not spread mainly horizontally or vertically. Instead, they stretch along a diagonal direction. In that case, the original axes are not the best way to describe the true structure of the data.
PCA finds that diagonal direction as the first principal component. Then it finds another direction, orthogonal to the first, that captures the next largest variation. PCA does not merely shrink the data; it first reorients the data space to align with the most meaningful directions.
What Is a Principal Component?
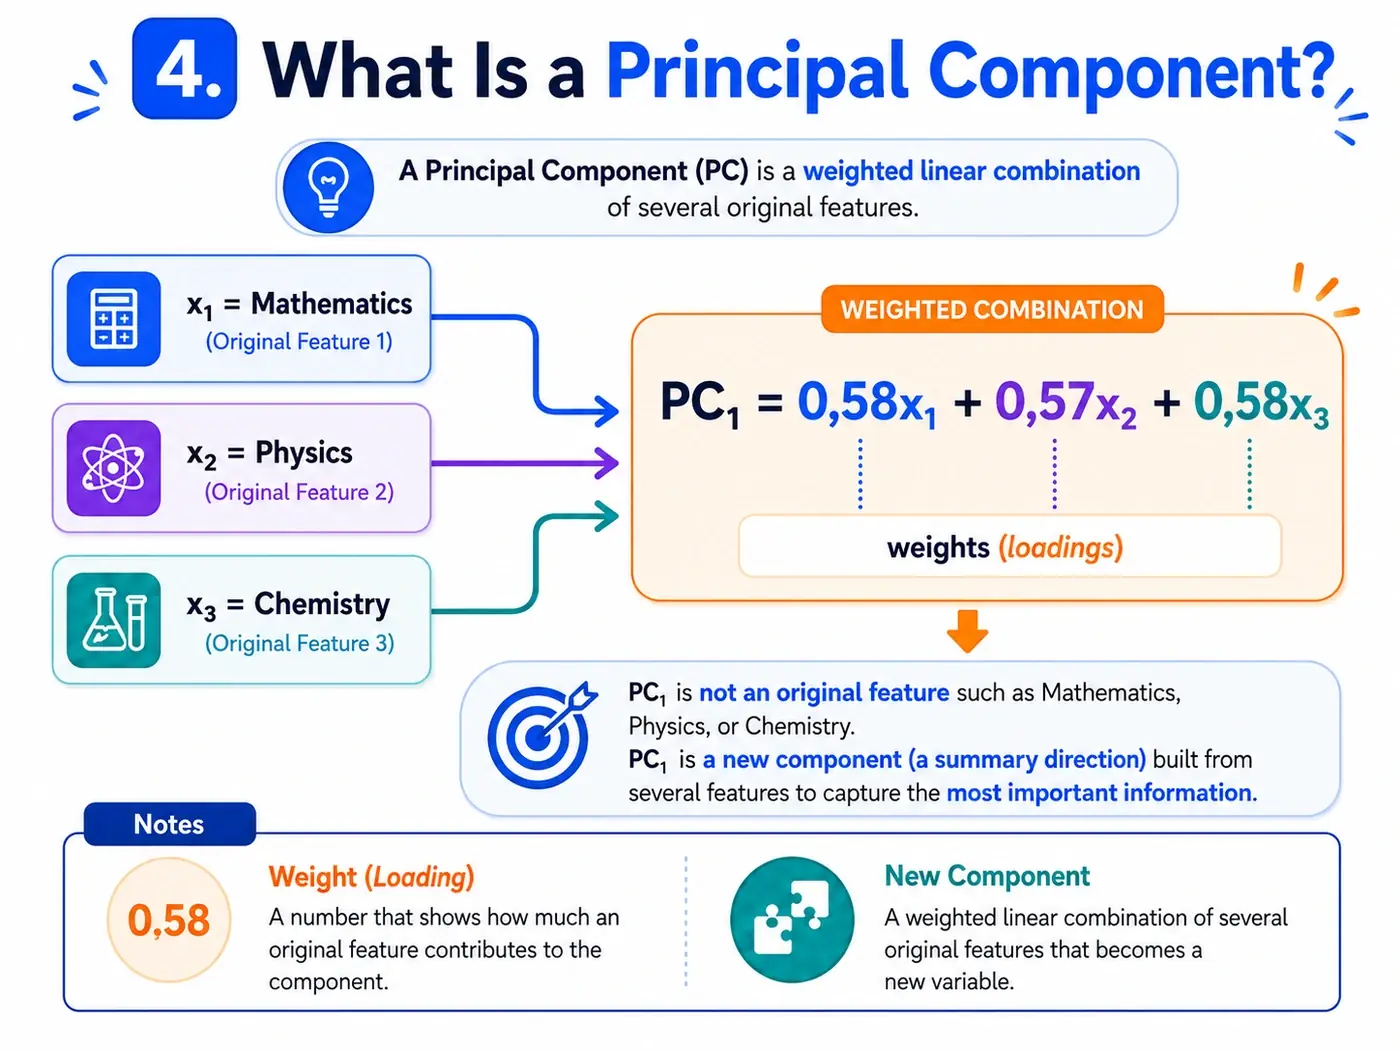
A principal component is not one of the original features. It is a weighted linear combination of the original features. Suppose our original features are math, physics, and chemistry scores. A component might look like this:
PC1 = 0.58 × math + 0.57 × physics + 0.58 × chemistryThis means PC1 is not simply math, physics, or chemistry. It is a new direction built from all three features. The weights show how strongly each original feature contributes to the component.
This is crucial: PCA does not copy columns from the original dataset. It creates new summary directions from the old columns.
Practical Example: Student Scores
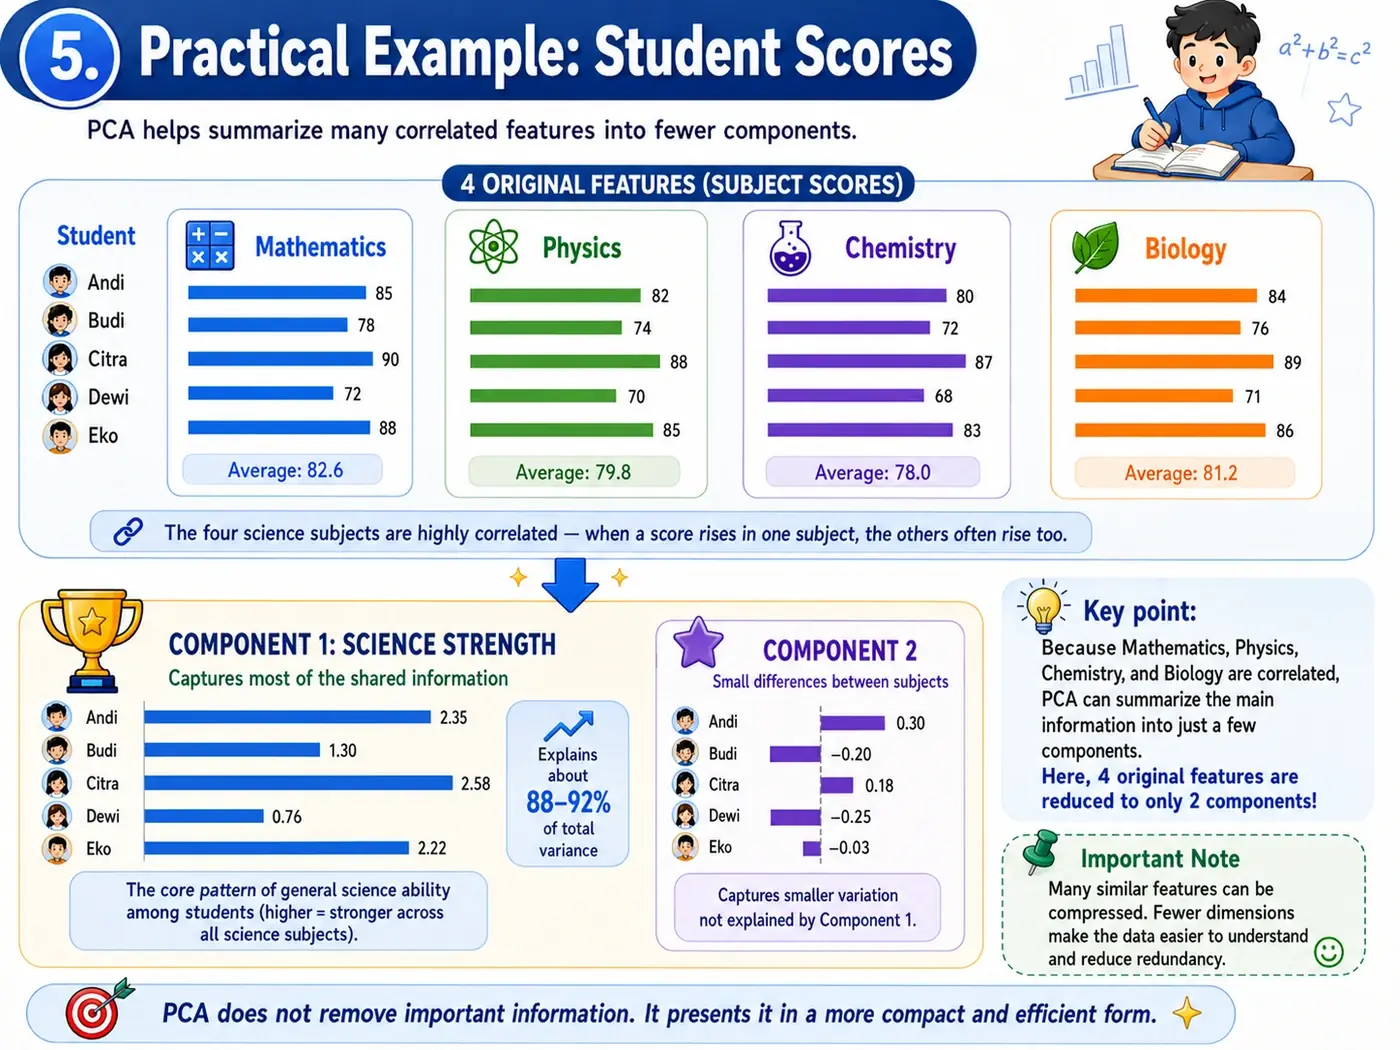
Consider a student dataset with four features: math, physics, chemistry, and biology scores. These subjects are likely correlated. A student who performs well in one science subject may also perform well in the others.
PCA can discover this shared pattern and summarize it into a new component, such as “science strength.” In this way, four overlapping features can be represented by one or two more compact components.
How PCA Works at a High Level
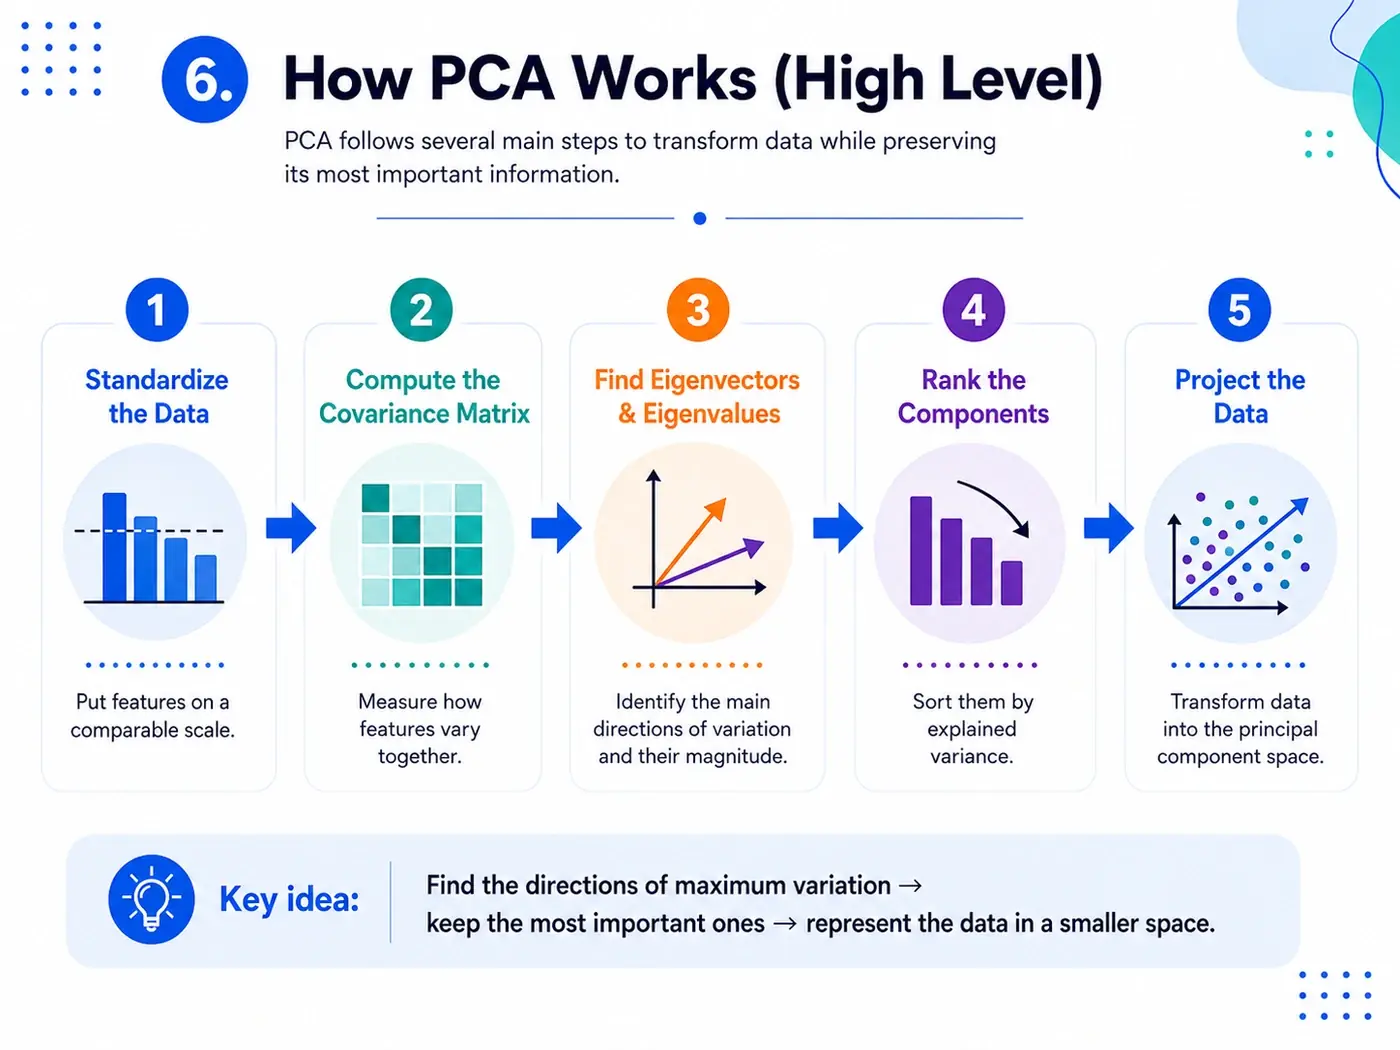
In practice, PCA follows several main steps. We do not need to compute all of them manually to use PCA well, but understanding the flow helps us apply it correctly.
- Standardize the data so features are on comparable scales.
- Compute the covariance matrix to measure how features vary together.
- Find eigenvectors and eigenvalues, which describe the main directions of variation and their magnitude.
- Rank the components by the variance they capture.
- Project the data into the smaller principal component space.
Through this process, PCA finds the directions of maximum variation, keeps the most informative directions, and represents the data in a smaller space.
Explained Variance: How Much Information Do We Keep?
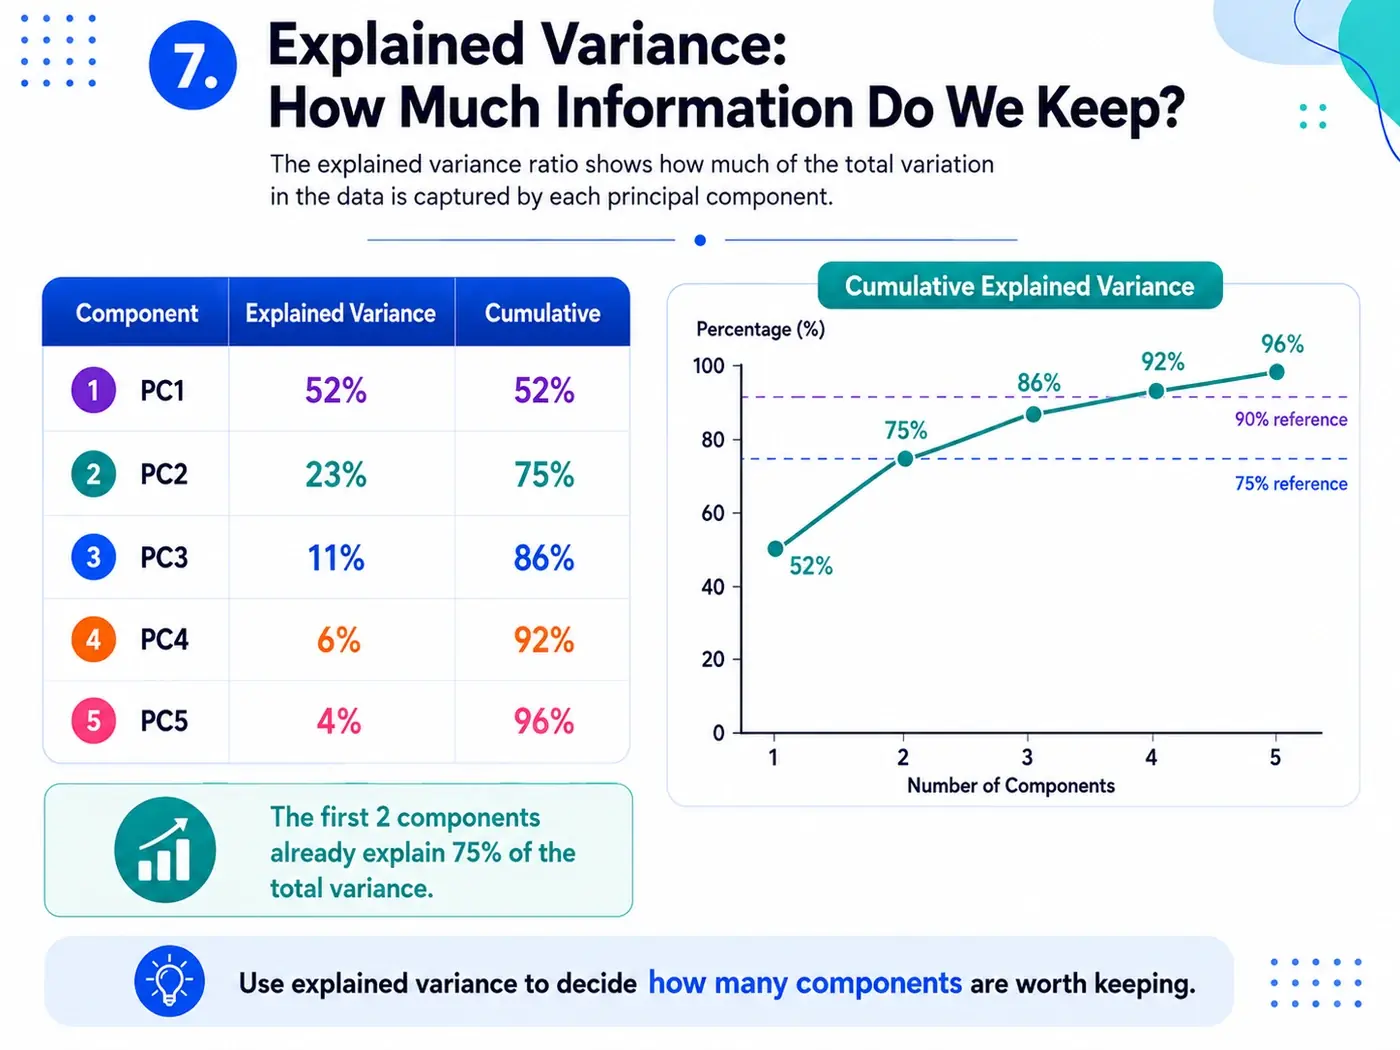
One of the most useful PCA outputs is the explained variance ratio. It tells us how much of the total variation in the data is captured by each component.
For example, PC1 might explain 52% of the variance, PC2 23%, PC3 11%, and PC4 6%. If the first two components already explain 75% of the variance, we may decide that two components are enough, depending on our goal.
Explained variance helps us answer: how much of the data structure remains after dimensionality reduction?
Why Standardization Matters
Because PCA is based on variance, feature scale matters a lot. A feature with a larger numerical range can dominate the principal components even if it is not more meaningful.
For example, salary may range from 20,000 to 200,000, while a satisfaction score may range from 1 to 10. Without scaling, salary may dominate simply because its values vary on a larger scale.
PCA for Data Visualization
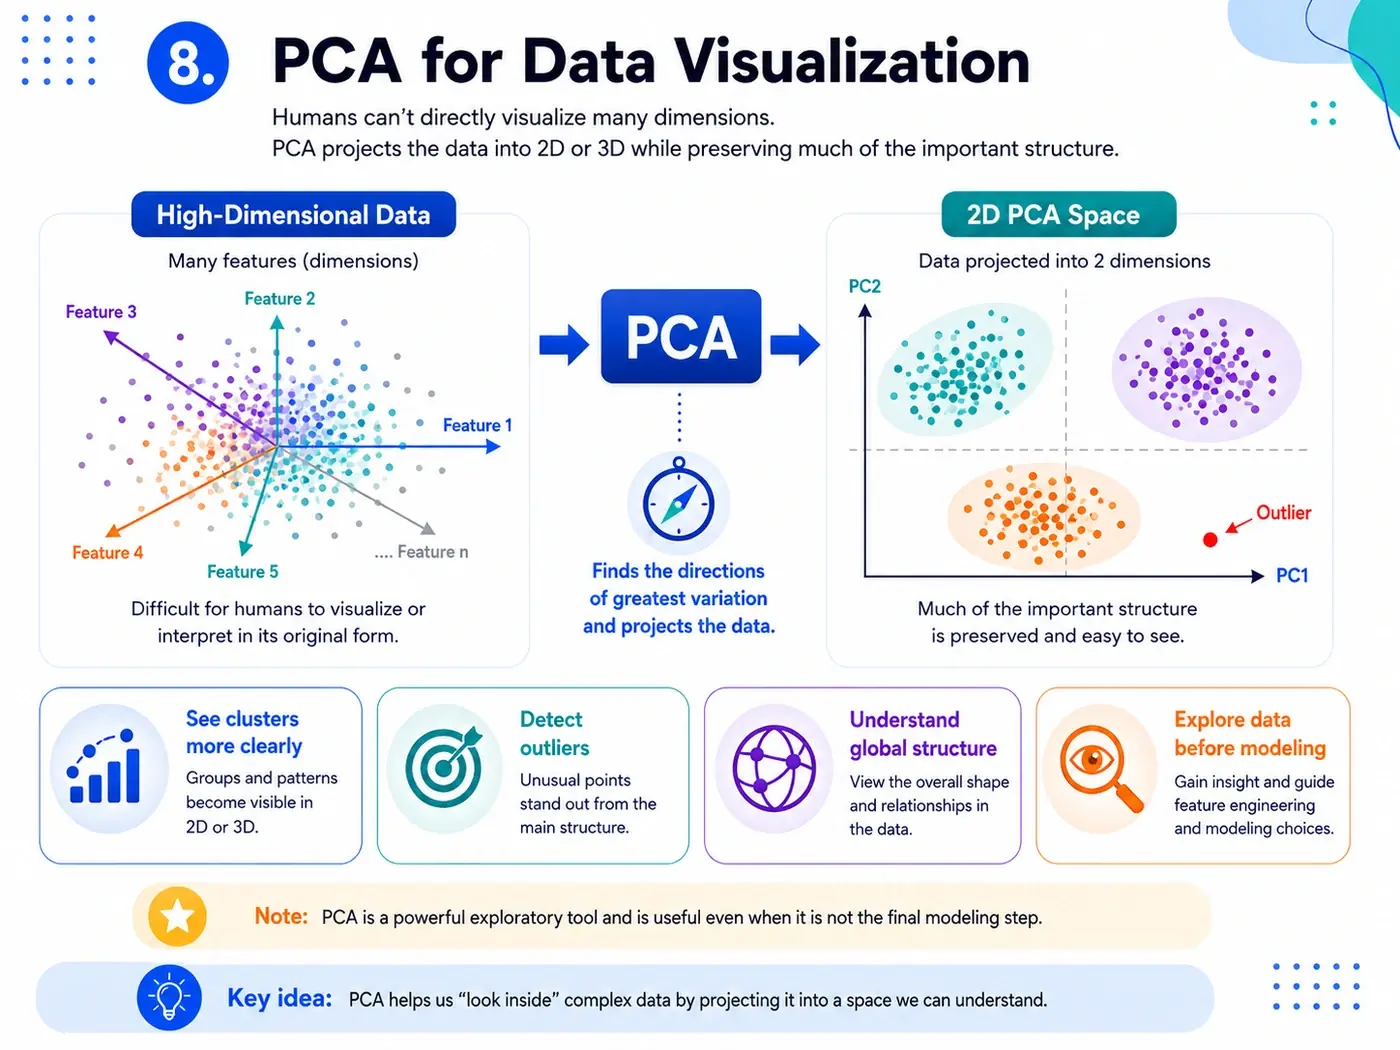
Humans are not good at understanding dozens of dimensions directly. We are comfortable with 2D, sometimes 3D, but 40 or 100 dimensions quickly become impossible to reason about visually.
PCA helps by projecting high-dimensional data into two or three principal components. This lets us inspect clusters, outliers, spread, and global structure more clearly.
Even when PCA is not the final model, it remains useful as an exploratory tool before clustering, classification, regression, or anomaly detection.
PCA vs Feature Selection vs Clustering
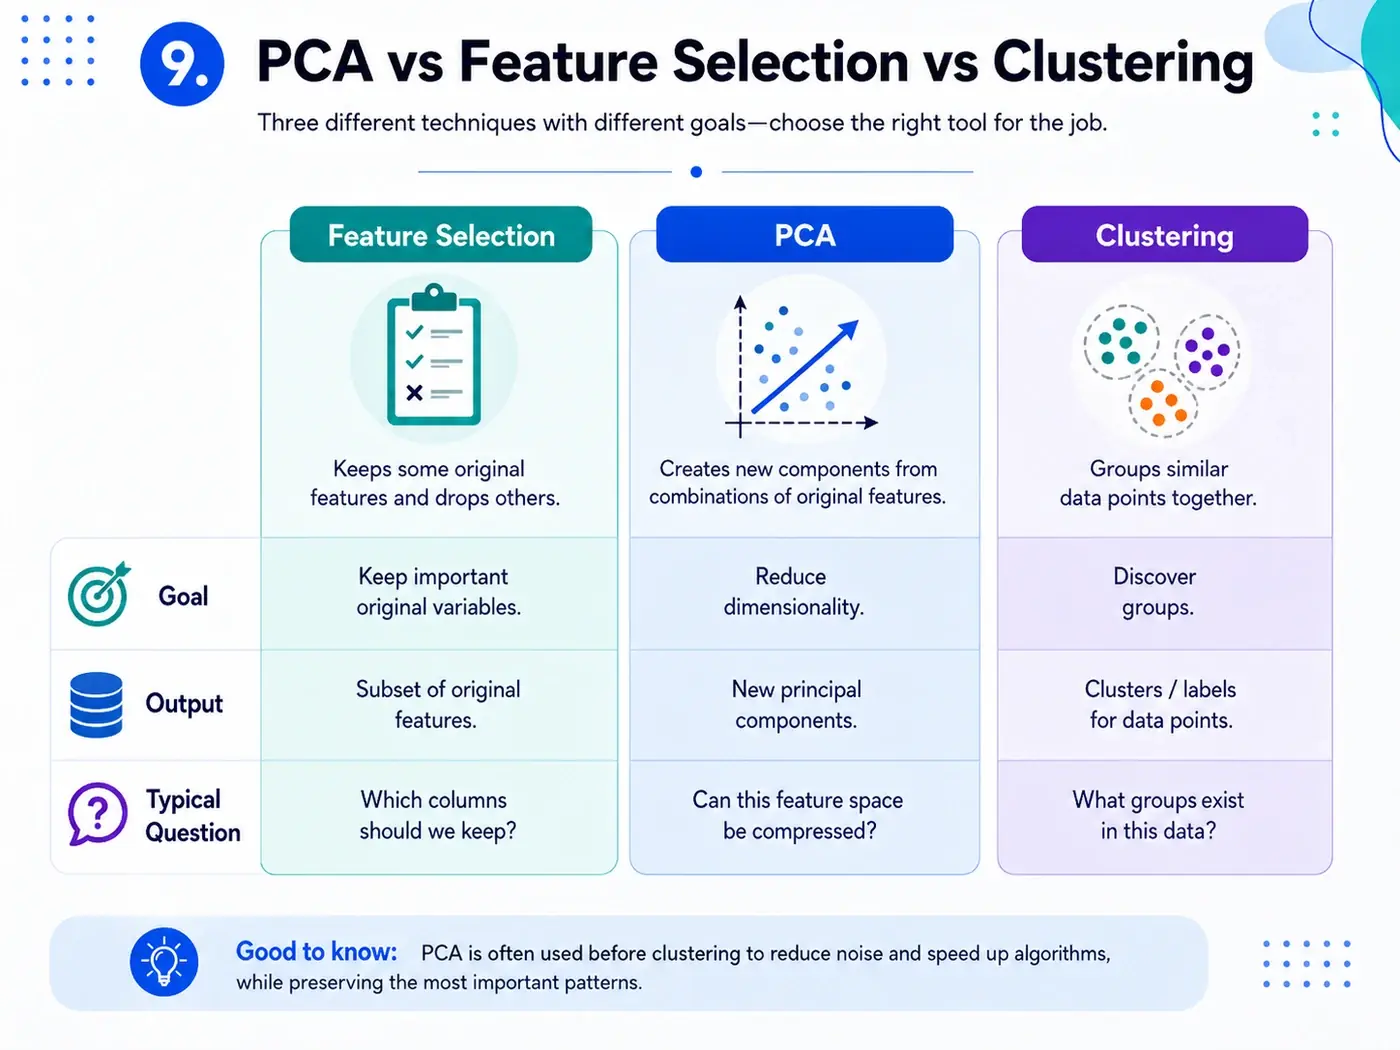
PCA is often mentioned alongside feature selection and clustering, but they solve different problems.
- Feature selection keeps some original features and drops the rest.
- PCA creates new components from combinations of original features.
- Clustering groups data points based on similarity.
If the question is “which original columns should we keep?”, feature selection is more natural. If the question is “can this feature space be compressed?”, PCA is more appropriate. If the question is “what groups exist in the data?”, clustering is the right direction.
In practice, PCA is often used before clustering to reduce noise and redundancy so group structure becomes easier to detect.
When PCA Helps and When We Should Be Careful
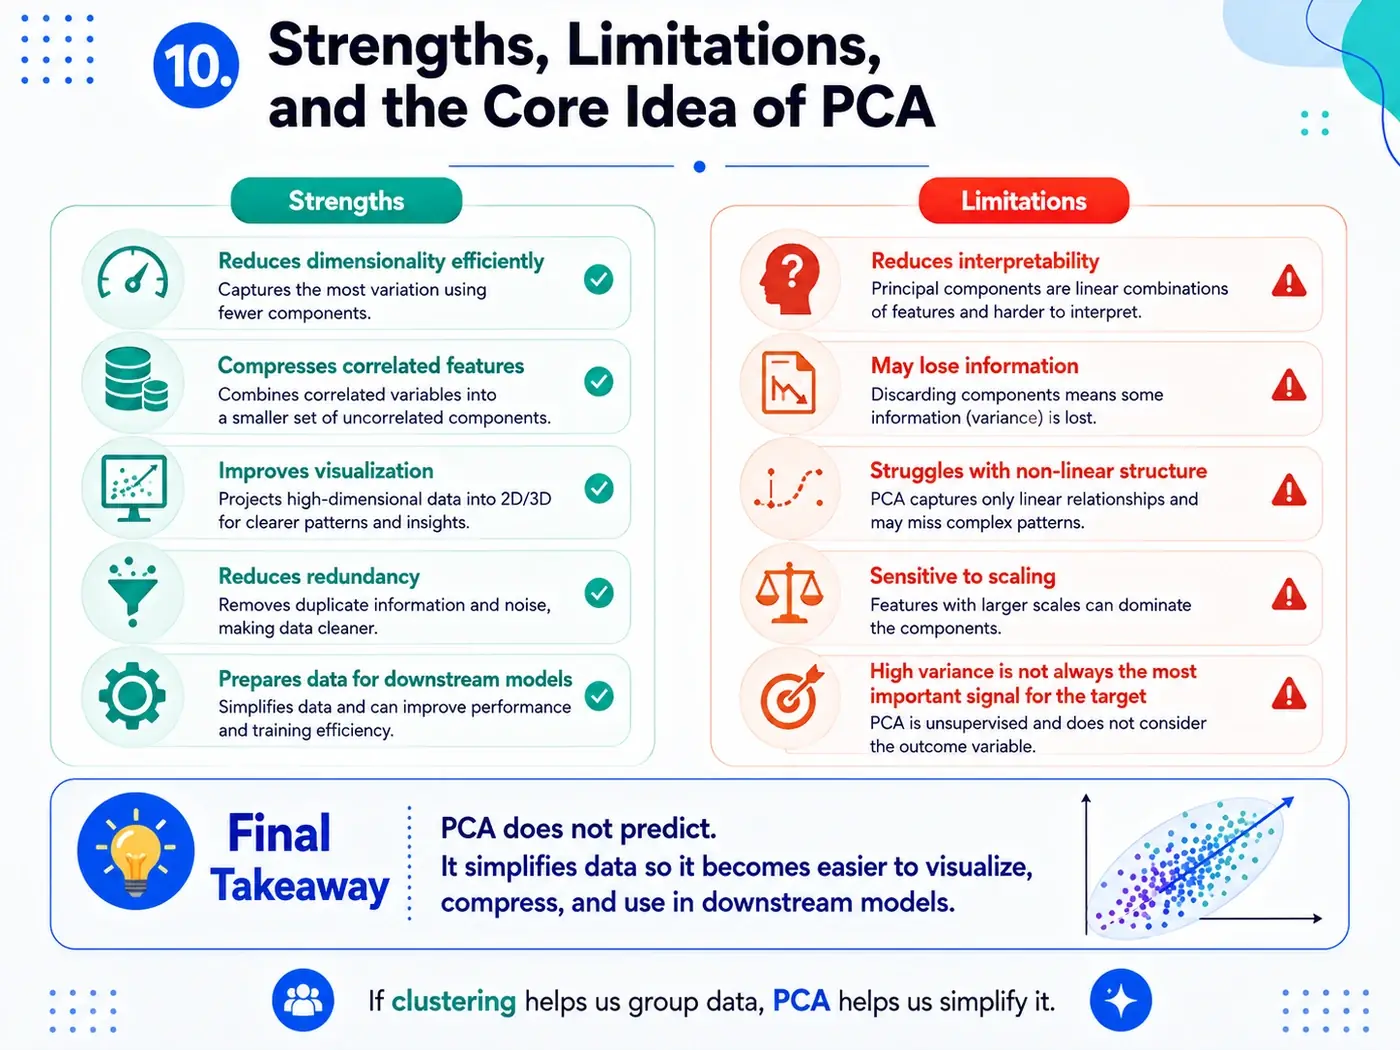
PCA is useful when many features are correlated, the dataset is high-dimensional, and we need a compact representation. It also helps visualization and can simplify inputs before downstream models.
However, PCA has limitations. The new components are harder to interpret because they mix many original variables. PCA can also lose information if we discard too many components. It is also a linear method, so it may miss complex non-linear structure.
Most importantly, PCA optimizes variance, not business meaning or prediction target usefulness. High variance is not always the same as high importance. A low-variance feature can still matter for the outcome we care about.
A Small Python Example
Here is a simple PCA example using scikit-learn.
from sklearn.decomposition import PCA
from sklearn.preprocessing import StandardScaler
import numpy as np

# Example data: [math, physics, chemistry, biology]
X = np.array([
    [85, 88, 90, 84],
    [78, 75, 80, 79],
    [92, 95, 94, 91],
    [60, 65, 63, 62],
    [70, 72, 68, 71]
])

# Standardize the data
scaler = StandardScaler()
X_scaled = scaler.fit_transform(X)

# Reduce to 2 principal components
pca = PCA(n_components=2)
X_pca = pca.fit_transform(X_scaled)

print("Transformed data:")
print(X_pca)

print("Explained variance ratio:")
print(pca.explained_variance_ratio_)
The parameter n_components=2 means we keep the first two principal components. The explained_variance_ratio_ output helps us evaluate whether those components preserve enough of the data structure.
Final Takeaway
PCA is one of the most important dimensionality reduction methods in machine learning. It transforms a complex feature space into a smaller set of new directions while preserving much of the important variation in the data.
PCA does not predict labels, does not directly create clusters, and does not choose original features like feature selection. Its role is to simplify data so it becomes easier to visualize, compress, and use in downstream models.
If clustering helps us group data, PCA helps us simplify the data space before further analysis.
Setosa PCA dan scikit-learn
Continue reading the original source for broader context and references.
Open original source →